Developing Optical Navigation Software for NASA’s New Horizons, OSIRIS-REx, and Lucy Missions
By Derek Nelson and Coralie Adam, KinetX
MATLAB enabled our team to accelerate the development and debugging of highly accurate OpNav algorithms. On the OSIRIS-REx mission, for example, the center-finding algorithms were accurate to within 30 centimeters, or about 0.06% of the asteroid’s diameter—significantly outperforming the predicted accuracy of the mission’s navigation Concept of Operations (ConOps).
In July 2015, NASA’s New Horizons spacecraft flew past Pluto, providing the world with spectacular images of the dwarf planet and its moons (Figure 1). Continuing its mission, New Horizons extended its exploration of the Kuiper Belt when it flew by Arrokoth in 2019, sending back images of the most distant object ever explored by a spacecraft. Meanwhile, a second NASA spacecraft, OSIRIS-REx, launched in 2016 to retrieve a sample from the surface of the asteroid Bennu. After collecting this sample in 2020, it will return the sample to Earth in September 2023. In the meantime, NASA launched Lucy in 2021, which will become the first spacecraft to visit the Trojan asteroids of Jupiter.

Figure 1. Illustration of the New Horizons spacecraft passing Pluto and its moon, Charon.
These overlapping NASA missions share a common objective: giving scientists the data needed to develop a deeper understanding of our solar system, including its formation and the objects within it. The three missions have something else in common—they all rely on optical navigation (OpNav) software built by our team at KinetX Aerospace. OpNav techniques use camera images to determine the position of the spacecraft relative to a celestial body, such as a planet or asteroid. Developed in MATLAB®, the KinetX Image Processing software suite (KXIMP) processes images captured with an onboard camera. These images are downlinked to Earth to calculate the inertial camera attitude, as well as the centroids of background stars and celestial bodies in the field of view. MATLAB enabled our team to accelerate the development and debugging of highly accurate OpNav algorithms. On the OSIRIS-REx mission, for example, the center-finding algorithms were accurate to within 30 centimeters, or about 0.06% of the asteroid’s diameter—significantly outperforming the predicted accuracy of the mission’s navigation Concept of Operations (ConOps).
The Need for OpNav and the Importance of Rapid Development
Traditionally, deep space navigation has relied on radiometric tracking data, which can be used to estimate a spacecraft’s position relative to the Earth. When there is little uncertainty in the target’s trajectory, this approach is sufficiently accurate. For missions like New Horizons, OSIRIS-REx, and Lucy, however, radio-based navigation can get the spacecraft close—but not necessarily close enough to maximize the scientific benefits of the mission. By contrast, OpNav provides measurements of the target’s position relative to the spacecraft, enabling much greater navigational accuracy along with the ability to direct the spacecraft’s cameras and scientific instruments to the target with greater precision.
Our team was small when we first began evaluating development environments for OpNav algorithms. We needed to prioritize rapid development and debugging, which meant that we didn’t want to write significant amounts of low-level image processing algorithms from scratch. MATLAB and Image Processing Toolbox™ provided many of the routines and functions we needed from the start. Just as importantly, we needed the ability to quickly implement changes as new information became available. The importance of this was underscored as New Horizons approached Pluto. Due to albedo variations, the brightest and the darkest parts of the planet resulted in images with unexpectedly high contrast, which we needed to account for in KXIMP. The changes we needed to make turned out to be fairly complex, and the ability to quickly implement and debug them in MATLAB was crucial while the mission was approaching a critical operation phase.
Using KXIMP for Navigation to Pluto, Arrokoth, and Bennu
We apply the same basic process for using the KXIMP software suite for every mission. The process starts when we receive an image from the spacecraft’s onboard cameras. As a first step, we remove distortions and correct the image using camera calibration routines that we have developed in MATLAB.
Next, we run KXIMP’s attitude determination algorithm. This algorithm fits a paraboloid to find the subpixel center of each star in the image (Figure 2). It then calculates the predicted centers of the stars in the image based on a star catalog and an a priori estimate of the attitude. A least-squares fitting with Optimization Toolbox™ is then performed based on the observed star centers and predicted centers to compute the camera’s inertial attitude.
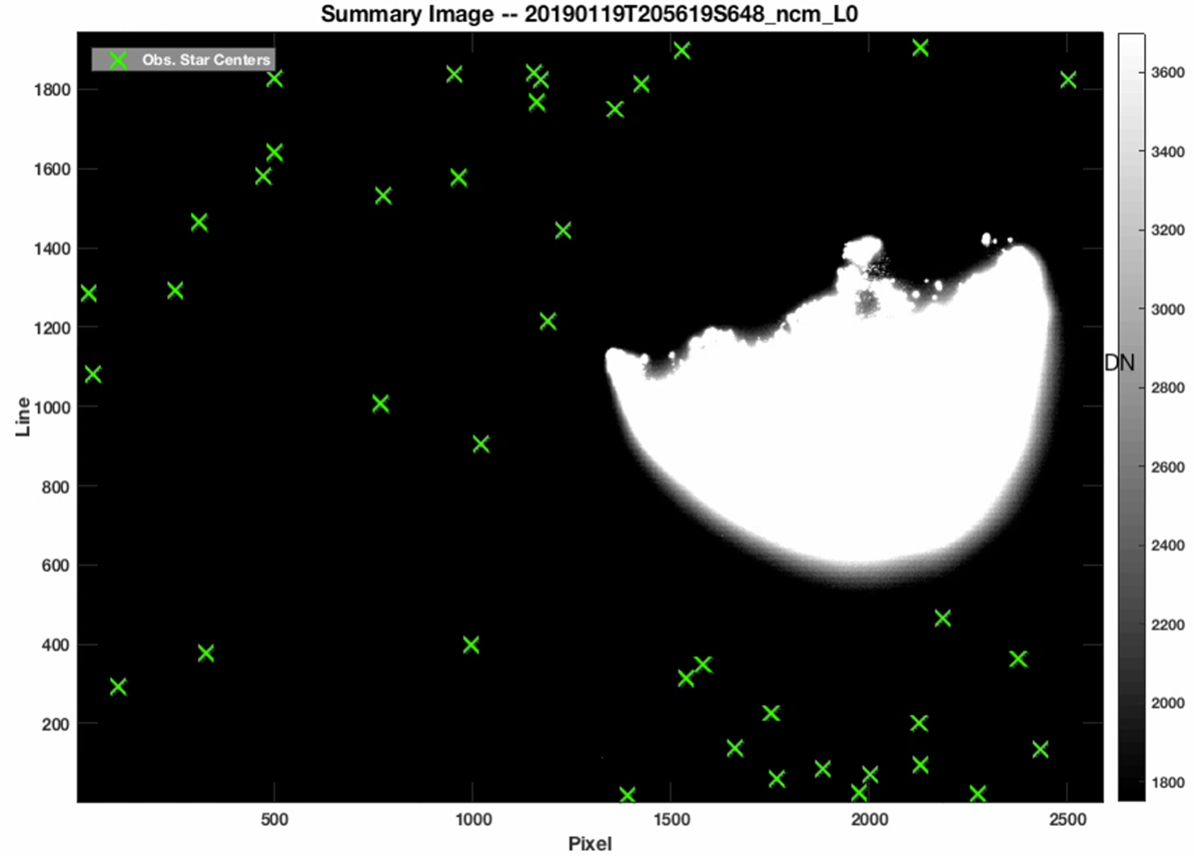
Figure 2. Background stars (marked with crosses) with the asteroid Bennu on the right.
Once we have determined the attitude of the camera, the next step is to find the centroid of the target (for example, Pluto, Arrokoth, or Bennu). The algorithm that calculates this centroid, correlates the real image from the spacecraft with a simulated image that is produced using a key feature of KXIMP. The simulated image is created using information from a digital shape kernel file from the SPICE toolbox provided by NASA’s Navigation and Ancillary Information Facility (NAIF) and accessed via the MATLAB toolkit for SPICE. Using this shape information, the position of the sun relative to the target, and the rotational state of the target, our algorithm applies ray tracing techniques to generate the simulated image (Figure 3). Because processing time can be an important factor—particularly with spacecraft traveling at 14 kilometers per second—we speed up this part of the process by performing the ray tracing on a multicore processor using Parallel Computing Toolbox™. The center of the target is then computed via 2D cross-correlation of the real and simulated images.

Figure 3. An actual image of Bennu (left) and a simulated image of Bennu generated by KXIMP (right).
At greater distances, the target is often unresolved in the real image and may be only a few pixels wide. During this phase of operations, we use image coadding, star-subtraction, and subsampling techniques in KXIMP to produce images with greater effective resolution (Figure 4) and signal-to-noise ratio.
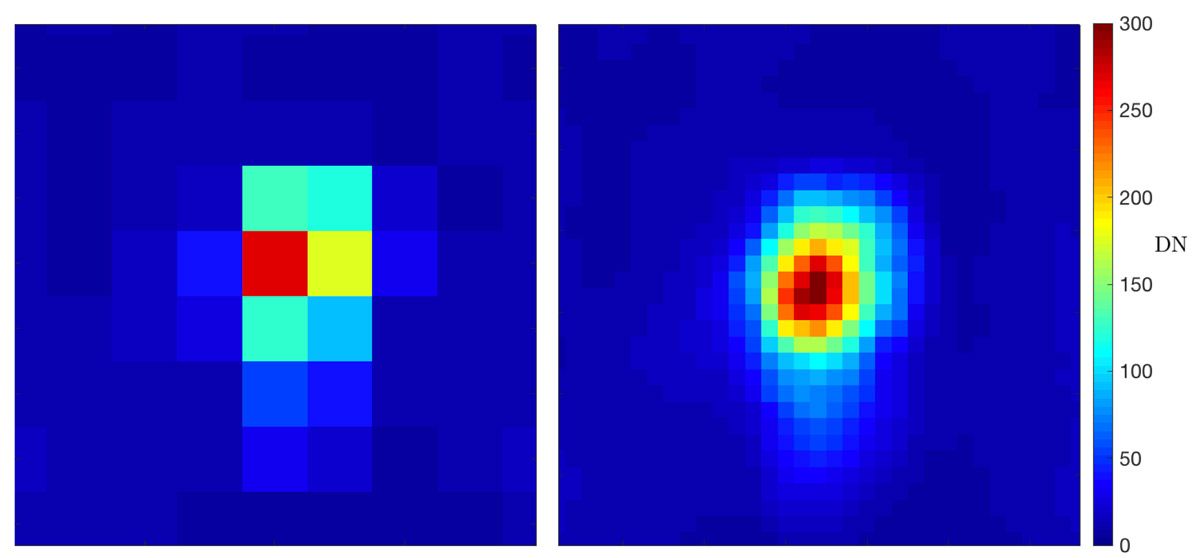
Figure 4. Original image of Arrokoth, in which the target is a visibly unresolved point source (left) and a corresponding image that has been 4x subsampled (right).
Code Generation for Onboard OpNav
For the New Horizons, OSIRIS-REx, and Lucy missions, KXIMP OpNav processing is performed once images are downlinked to Earth. Going forward, however, more of this processing will be performed using onboard systems running autonomous OpNav software. Our team is actively working on these efforts. For NASA’s LunaH-Map spacecraft, for example, we used MATLAB Coder™ to generate C code from our existing algorithms for attitude determination, centroiding stars, and unresolved targets (Figure 5), as well as from a new horizon-based navigation algorithm. The generated onboard attitude determination and unresolved center-finding flight software have been successfully tested on the LunaH-Map mission, laying the groundwork for future spacecraft equipped with autonomous OpNav software to complete deep space missions with little or no reliance on ground-based navigation support.
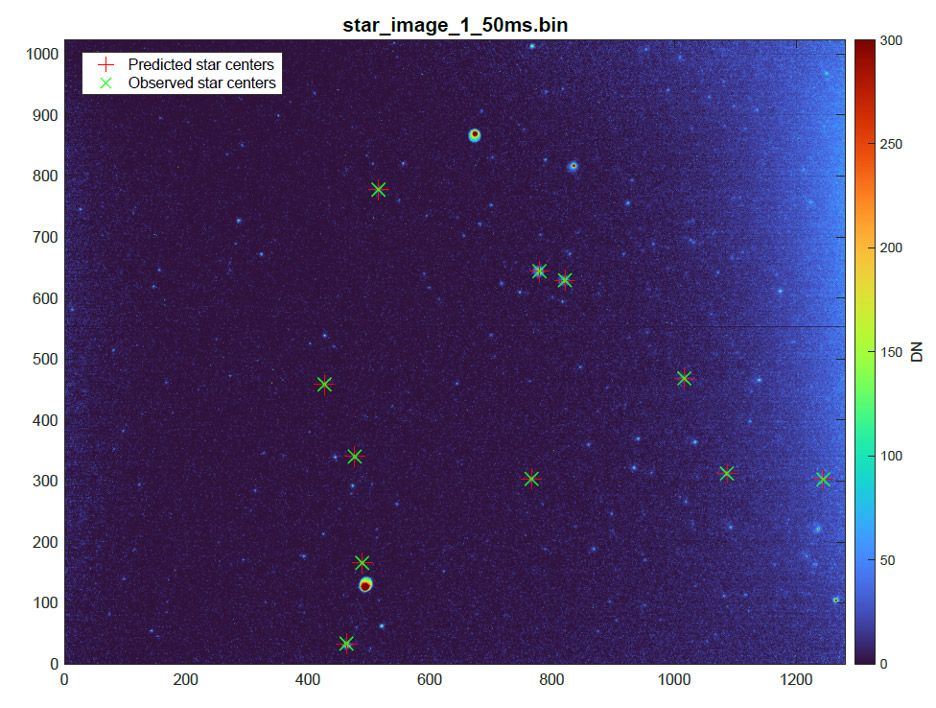
Figure 5. A LunaH-Map star tracker image of the constellation Auriga. Markers denote stars selected by KinetX software for attitude determination.
Published 2023