Statistics and Machine Learning Toolbox
Analyze and model data using statistics and machine learning
Have questions? Contact Sales.
Have questions? Contact Sales.
Statistics and Machine Learning Toolbox provides functions and apps to describe, analyze, and model data. You can use descriptive statistics, visualizations, and clustering for exploratory data analysis; fit probability distributions to data; generate random numbers for Monte Carlo simulations, and perform hypothesis tests. Regression and classification algorithms let you draw inferences from data and build predictive models either interactively, using the Classification and Regression Learner apps, or programmatically, using AutoML.
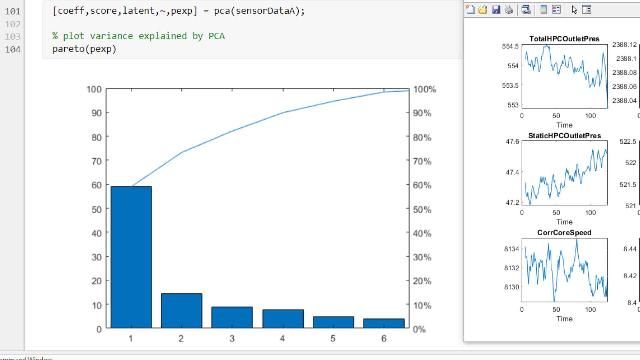
For multidimensional data analysis and feature extraction, the toolbox provides principal component analysis (PCA), regularization, dimensionality reduction, and feature selection methods that let you identify variables with the best predictive power.
The toolbox provides supervised, semi-supervised, and unsupervised machine learning algorithms, including support vector machines (SVMs), boosted decision trees, shallow neural nets, k-means, and other clustering methods. You can apply interpretability techniques such as partial dependence plots, Shapley values and LIME, and automatically generate C/C++ code for embedded deployment. Native Simulink blocks let you use predictive models with simulations and Model-Based design. Many toolbox algorithms can be used on data sets that are too big to be stored in memory.

Explore data through statistical plotting with interactive and visual graphics and descriptive statistics. Understand and describe potentially large sets of data quickly using descriptive statistics, including measures of central tendency, dispersion, shape, correlation, and covariance.

Identify patterns and features by applying k-means, hierarchical, DBSCAN and other clustering methods, and dividing data into groups or clusters. Determine the optimal number of clusters for the data using different evaluation criteria. Detect anomalies to identify outliers and novelties.

Assign sample variance to different sources and determine whether the variation arises within or among different population groups. Use one-way, two-way, multiway, multivariate, and nonparametric ANOVA, as well as analysis of covariance (ANOCOVA) and repeated measures analysis of variance (RANOVA).

Use the Regression Learner app or programmatically train and assess models such as linear regression, Gaussian processes, support vector machines, neural networks, and ensembles.

Use the Classification Learner app or programmatically train and validate models such as logistic regression, support vector machines, boosted trees, and shallow neural networks.

Extract features from images, signals, text, and numeric data. Iteratively explore and create new features and select the ones that optimize performance. Reduce dimensionality by transforming existing features into new predictor variables and drop less descriptive features after transformation, or by applying automated feature selection.

Fit continuous and discrete distributions, use statistical plots to evaluate goodness-of-fit, and compute probability density functions and cumulative distribution functions for more than 40 different distributions.

Draw inferences about a population based on statistical evidence from a sample. Perform t-tests, distribution tests, and nonparametric tests for one, paired, or independent samples. Test for autocorrection and randomness, and compare distributions.

Statistically analyze effects and data trends. Design experiments to create and test practical plans for how to manipulate data inputs to generate information about their effects on data outputs. Visualize and analyze time-to-failure data with and without censoring and monitor and assess the quality of industrial processes.

Use tall arrays and tables with many classification, regression, and clustering algorithms to train models on data sets that do not fit in memory without changing your code.

Generate portable and readable C/C++ code for inference of classification and regression models, descriptive statistics, and probability distributions. Generate C/C++ prediction code with reduced precision, and update parameters of deployed models without regenerating the prediction code.
30 days of exploration at your fingertips.
Get pricing information and explore related products.
Your school may already provide access to MATLAB, Simulink, and add-on products through a campus-wide license.

Tutorials and Examples

Self-Paced Online Course
You can also select a web site from the following list
Americas
Europe
Asia Pacific