polcmap
Create colormap appropriate to political regions
Syntax
Description
polcmap applies a random, muted colormap to the current figure. The size
of the colormap is the same as the existing colormap. This function is useful for
creating colormaps that help you distinguish one political region from its
neighbors.
polcmap( controls
the hue, saturation, and value of the colors. ncolors,huelimits,saturationlimits,valuelimits)polcmap randomly
selects values within the limit vectors. These are two-element vectors
of the form [min max]. Valid values range from
0 to 1. As the hue varies from 0 to 1, the resulting color varies
from red, through yellow, green, cyan, blue, and magenta, back to
red. When the saturation is 0, the colors are unsaturated; they are
simply shades of gray. When the saturation is 1, the colors are fully
saturated; they contain no white component. As the value varies from
0 to 1, the brightness increases.
cmap = polcmap(___)
Examples
Color Patches Using Random, Muted Colormap
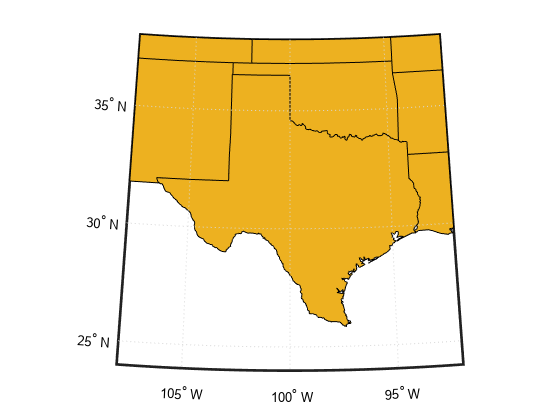
Create a map using a Lambert conformal conic projection and map limits covering Texas.
figure
usamap("texas")
Read state boundaries from a shapefile into a geospatial table. Display the boundaries on the map, noting that the default face color is yellow.
states = readgeotable("usastatelo.shp");
geoshow(states,"DisplayType","polygon")
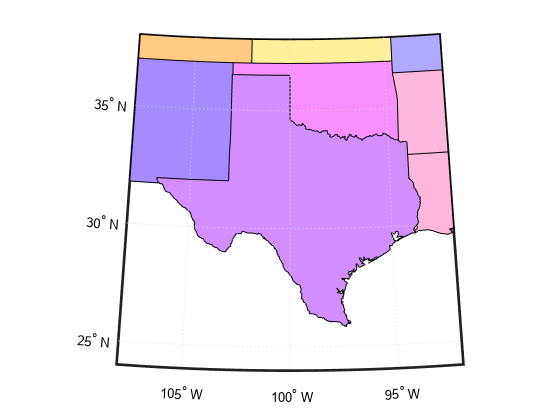
Define the colors you want to apply to the shapes (states) in a symbol specification. Use polcmap to create a colormap the same size as the number of rows in the geospatial table. polcmap creates a palette of muted colors.
h = height(states);
faceColors = makesymbolspec("Polygon", ...
     {'INDEX',[1 h],'FaceColor',polcmap(h)});
Display the map again using the symbol specification to color the patches (states) in the map. The colors you obtain for this example can vary each time you run this example because polcmap computes them randomly.
geoshow(states,"DisplayType","polygon","SymbolSpec",faceColors)
Specify Number and Saturation of Colors
Read state boundaries from a shapefile into a geospatial table. Set to a variable the number of rows in the table.
states = readgeotable("usastatelo.shp");
h = height(states);
Create a colormap with 256 colors and a maximum saturation of 0.2. To ensure that the colormap is always the same, seed the MATLAB® random number function using the rng function and a fixed value of your choice.
rng(0)
cmap = polcmap(256,0.2);
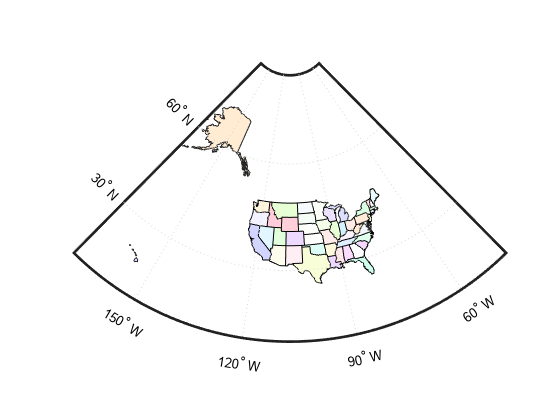
Use the colormap to display the state boundaries on a map of North America.
figure
worldmap na
faceColors = makesymbolspec("Polygon",{'INDEX',[1 h],'FaceColor',cmap});
geoshow(states,"SymbolSpec",faceColors)
Input Arguments
Output Arguments
Tips
You cannot use
polcmapto alter the colors of displayed patches drawn bygeoshowormapshow. The patches must have been rendered bydisplaym. However, you can color patches usingpolcmapwhen you callgeoshowormapshow(see Color Patches Using Random, Muted Colormap).
Version History
Introduced before R2006a
You can also select a web site from the following list:
Americas
- América Latina (Español)
- Canada (English)
- United States (English)
Europe
- Belgium (English)
- Denmark (English)
- Deutschland (Deutsch)
- España (Español)
- Finland (English)
- France (Français)
- Ireland (English)
- Italia (Italiano)
- Luxembourg (English)
- Netherlands (English)
- Norway (English)
- Österreich (Deutsch)
- Portugal (English)
- Sweden (English)
- Switzerland
- United Kingdom (English)